Ezoic Video has a dedicated section within Big Data Analytics that tracks video performance and revenue separately from your standard site reporting. This article covers what is reported and how to interpret each category.
Ezoic Video has a dedicated section within Big Data Analytics that tracks video performance and revenue separately from your standard site reporting. This article covers what is reported and how to interpret each category.
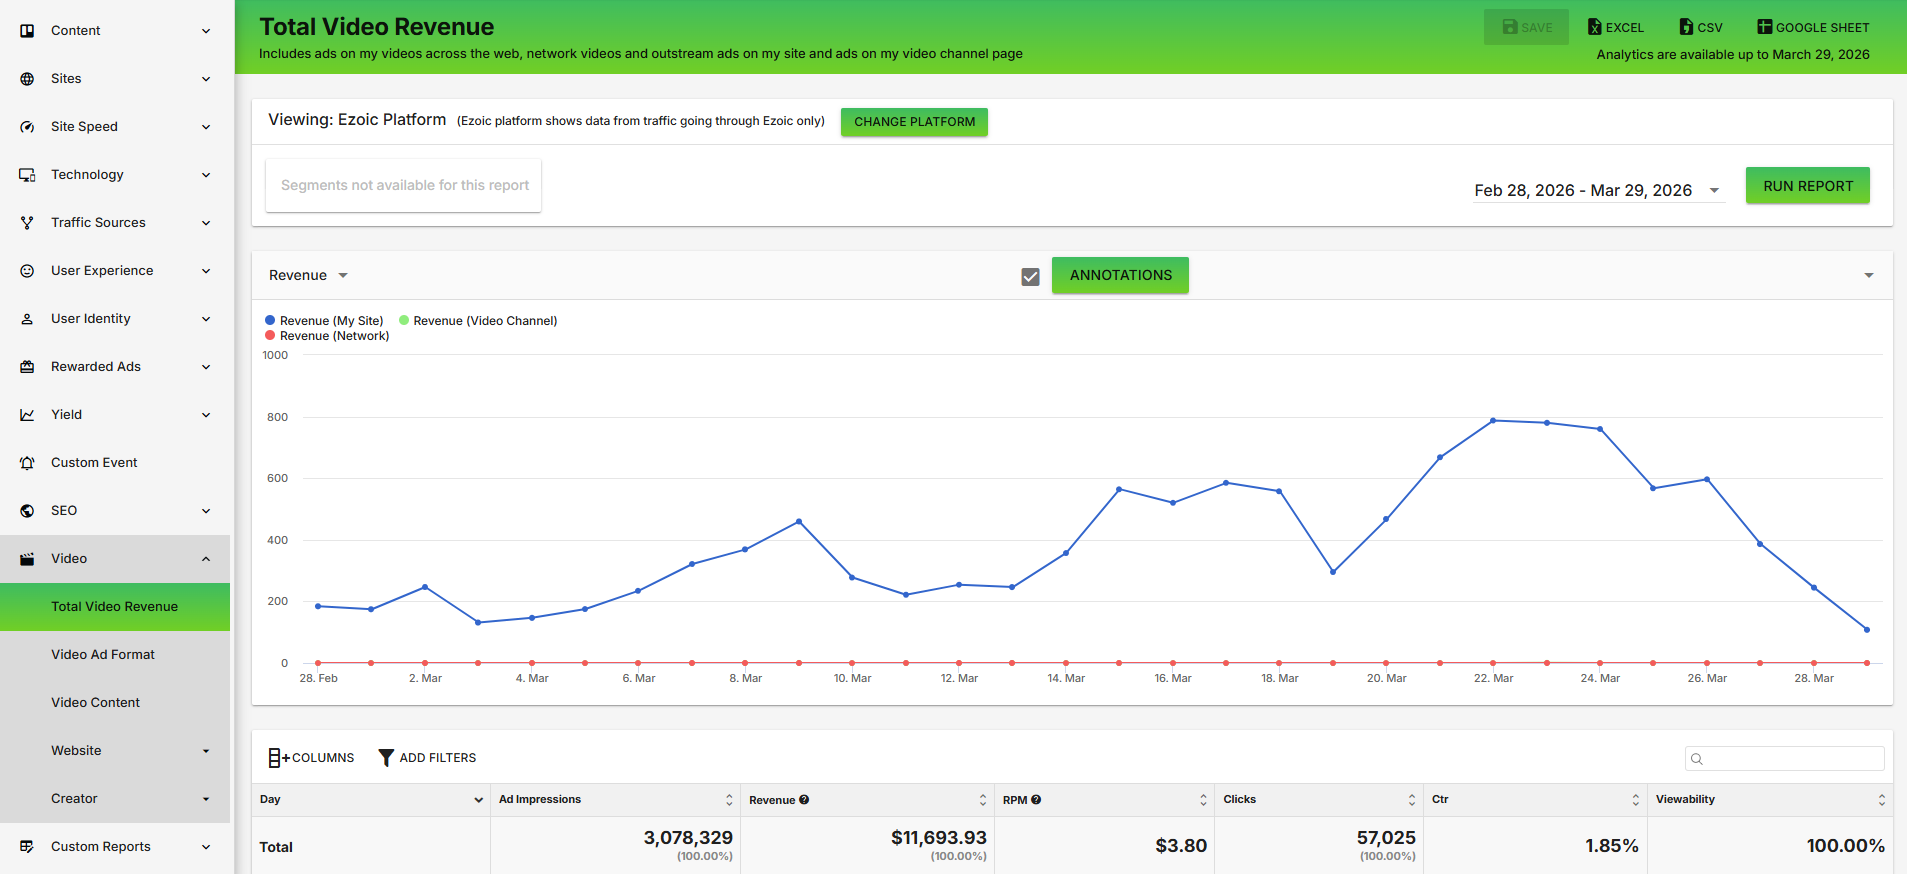
Navigate to Big Data Analytics > Video using the dropdown in the reports menu.
View counts include views from all pages and sites where your videos are displayed across the network.
Video Content shows how your videos perform wherever they appear across the network. Website shows performance on your site only. The difference tells you how much additional reach the network is generating.
Low average watch time on a specific video may indicate the content isn't matching the audience on the pages where it's being shown.
If one format significantly outperforms others, consider adjusting ad break settings in How to Set Custom Ad Breaks in Open.Video.
Go to Big Data Analytics in your Ezoic dashboard and select Video from the reports dropdown.
Website reflects video ads shown on your own site. Video Content reflects earnings from your videos displayed on other publishers' sites within the Ezoic network.
Video revenue is tracked separately in the Video section of BDA. Review both the standard Revenue reports and the Video reports for a complete view of total earnings.
